Real-Time Dashboard
See current readings for every location at a glance, with clear colour-coded gauges and averages for indoor and outdoor air.
- Facility & room views
- Top 10 locations

The AirGradient monitoring software turns readings from your monitors into clear, real-time insights, alerts and reports, all for one simple annual subscription of $36 per year.
From a single living room to hundreds of classrooms and offices, the AirGradient Dashboard keeps every monitor, reading and alert in one clean, easy-to-read place.
See current readings for every location at a glance, with clear colour-coded gauges and averages for indoor and outdoor air.
Compare hours, days and weeks to spot patterns, find the busiest rooms and measure the impact of ventilation or air treatment.
Set thresholds for PM2.5, CO₂ and more, and get notified the moment conditions change so you can act quickly.
Download your measurements for reports and audits, or connect them to your own systems. Your data always belongs to you.
Share live air quality on lobby screens, classroom TVs or your website, so staff, families and visitors can see it too.
Organise monitors by building and room, check device health with monitor uptime, and manage everything from one account.
A real view from the AirGradient Dashboard. Hover or tap the numbers to see what each area shows.
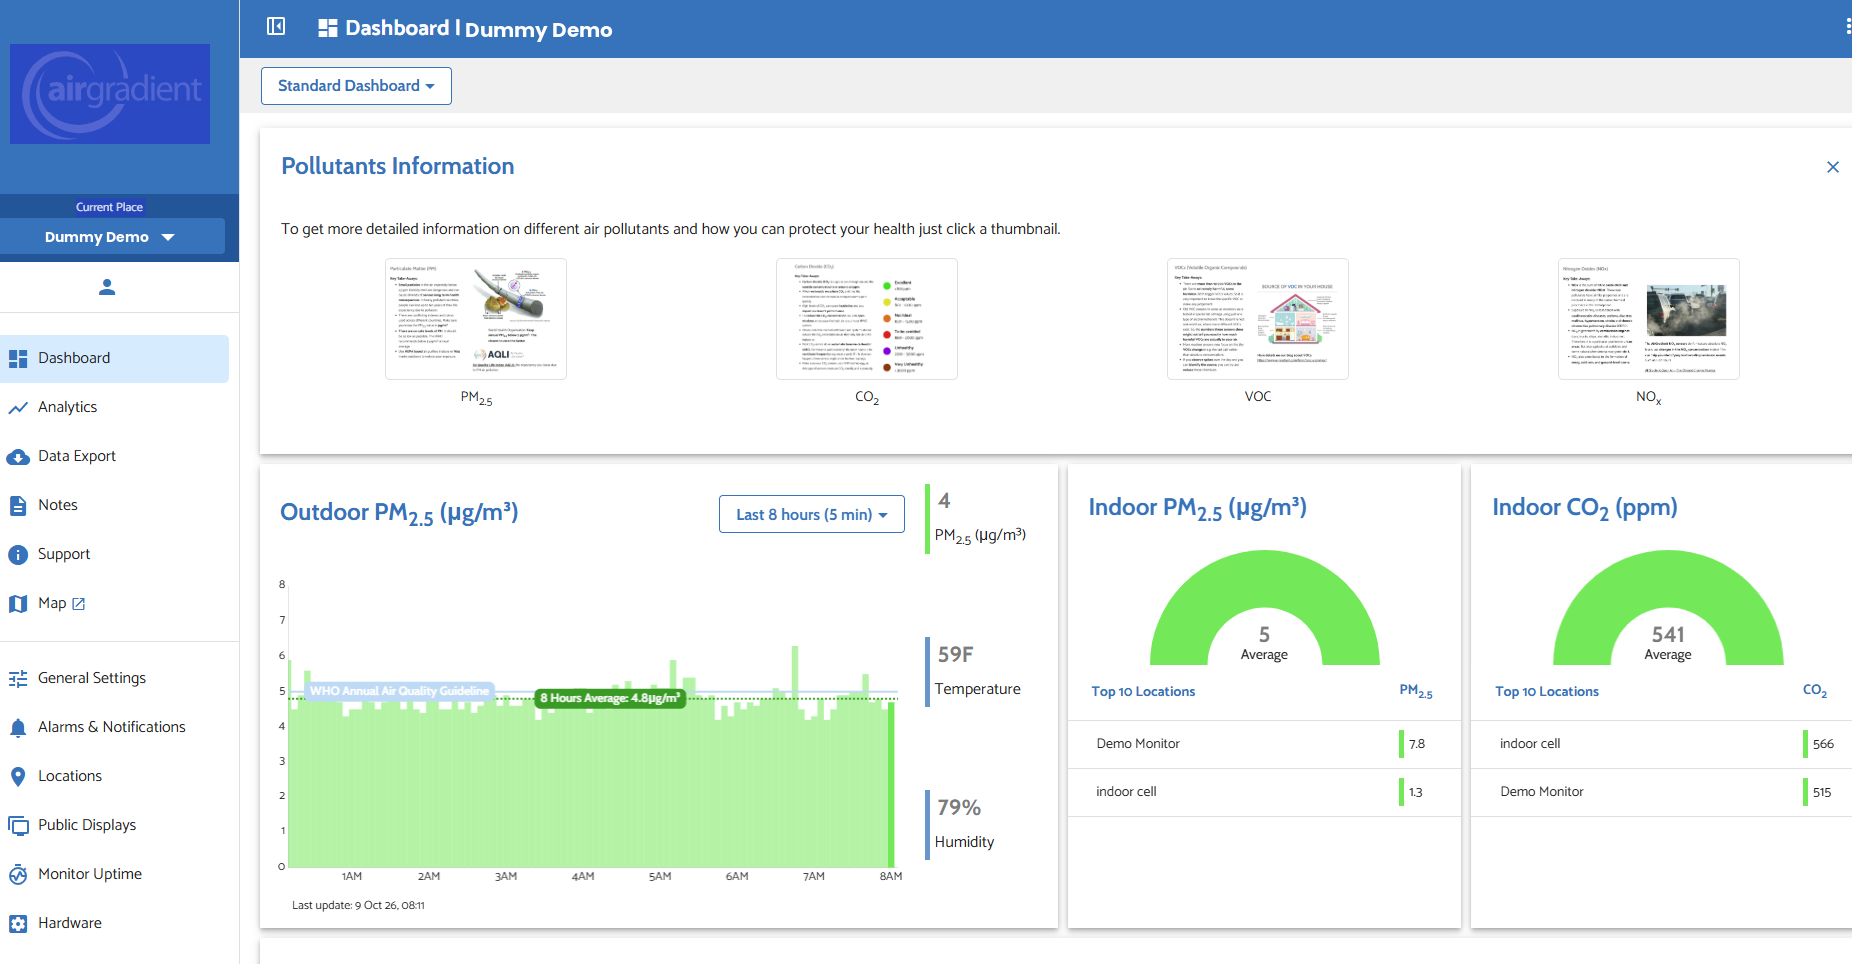
Built-in explainers for PM2.5, CO₂, VOCs and NOx and how to protect your health.
8-hour history against the WHO guideline, plus temperature and humidity.
Average PM2.5 and CO₂ across rooms, with your top 10 locations ranked.
Analytics, data export, alarms, locations, public displays and monitor uptime.
Pair an indoor AirGradient ONE with an outdoor Open Air monitor and the dashboard compares them automatically, so you can see exactly how well your space is protecting the people inside.
Example from a live demo location, PM2.5 in µg/m³
WHO annual PM2.5 guideline: 5 µg/m³
Nothing to install and nothing to maintain. Plug in, subscribe, and your data starts flowing.
Set up an AirGradient ONE indoors, an Open Air outside, or carry a GO with you.
Connect the monitor to Wi-Fi and activate your AirGradient Dashboard annual subscription.
Open the dashboard from any browser to view live data, trends, alerts and reports.
Mix indoor, outdoor and portable monitors and see them all side by side.
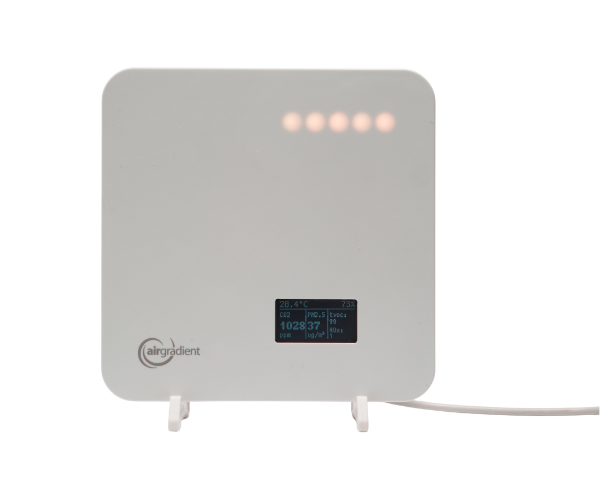
Tracks PM2.5, CO₂ and VOCs in homes, classrooms and offices.
Learn more →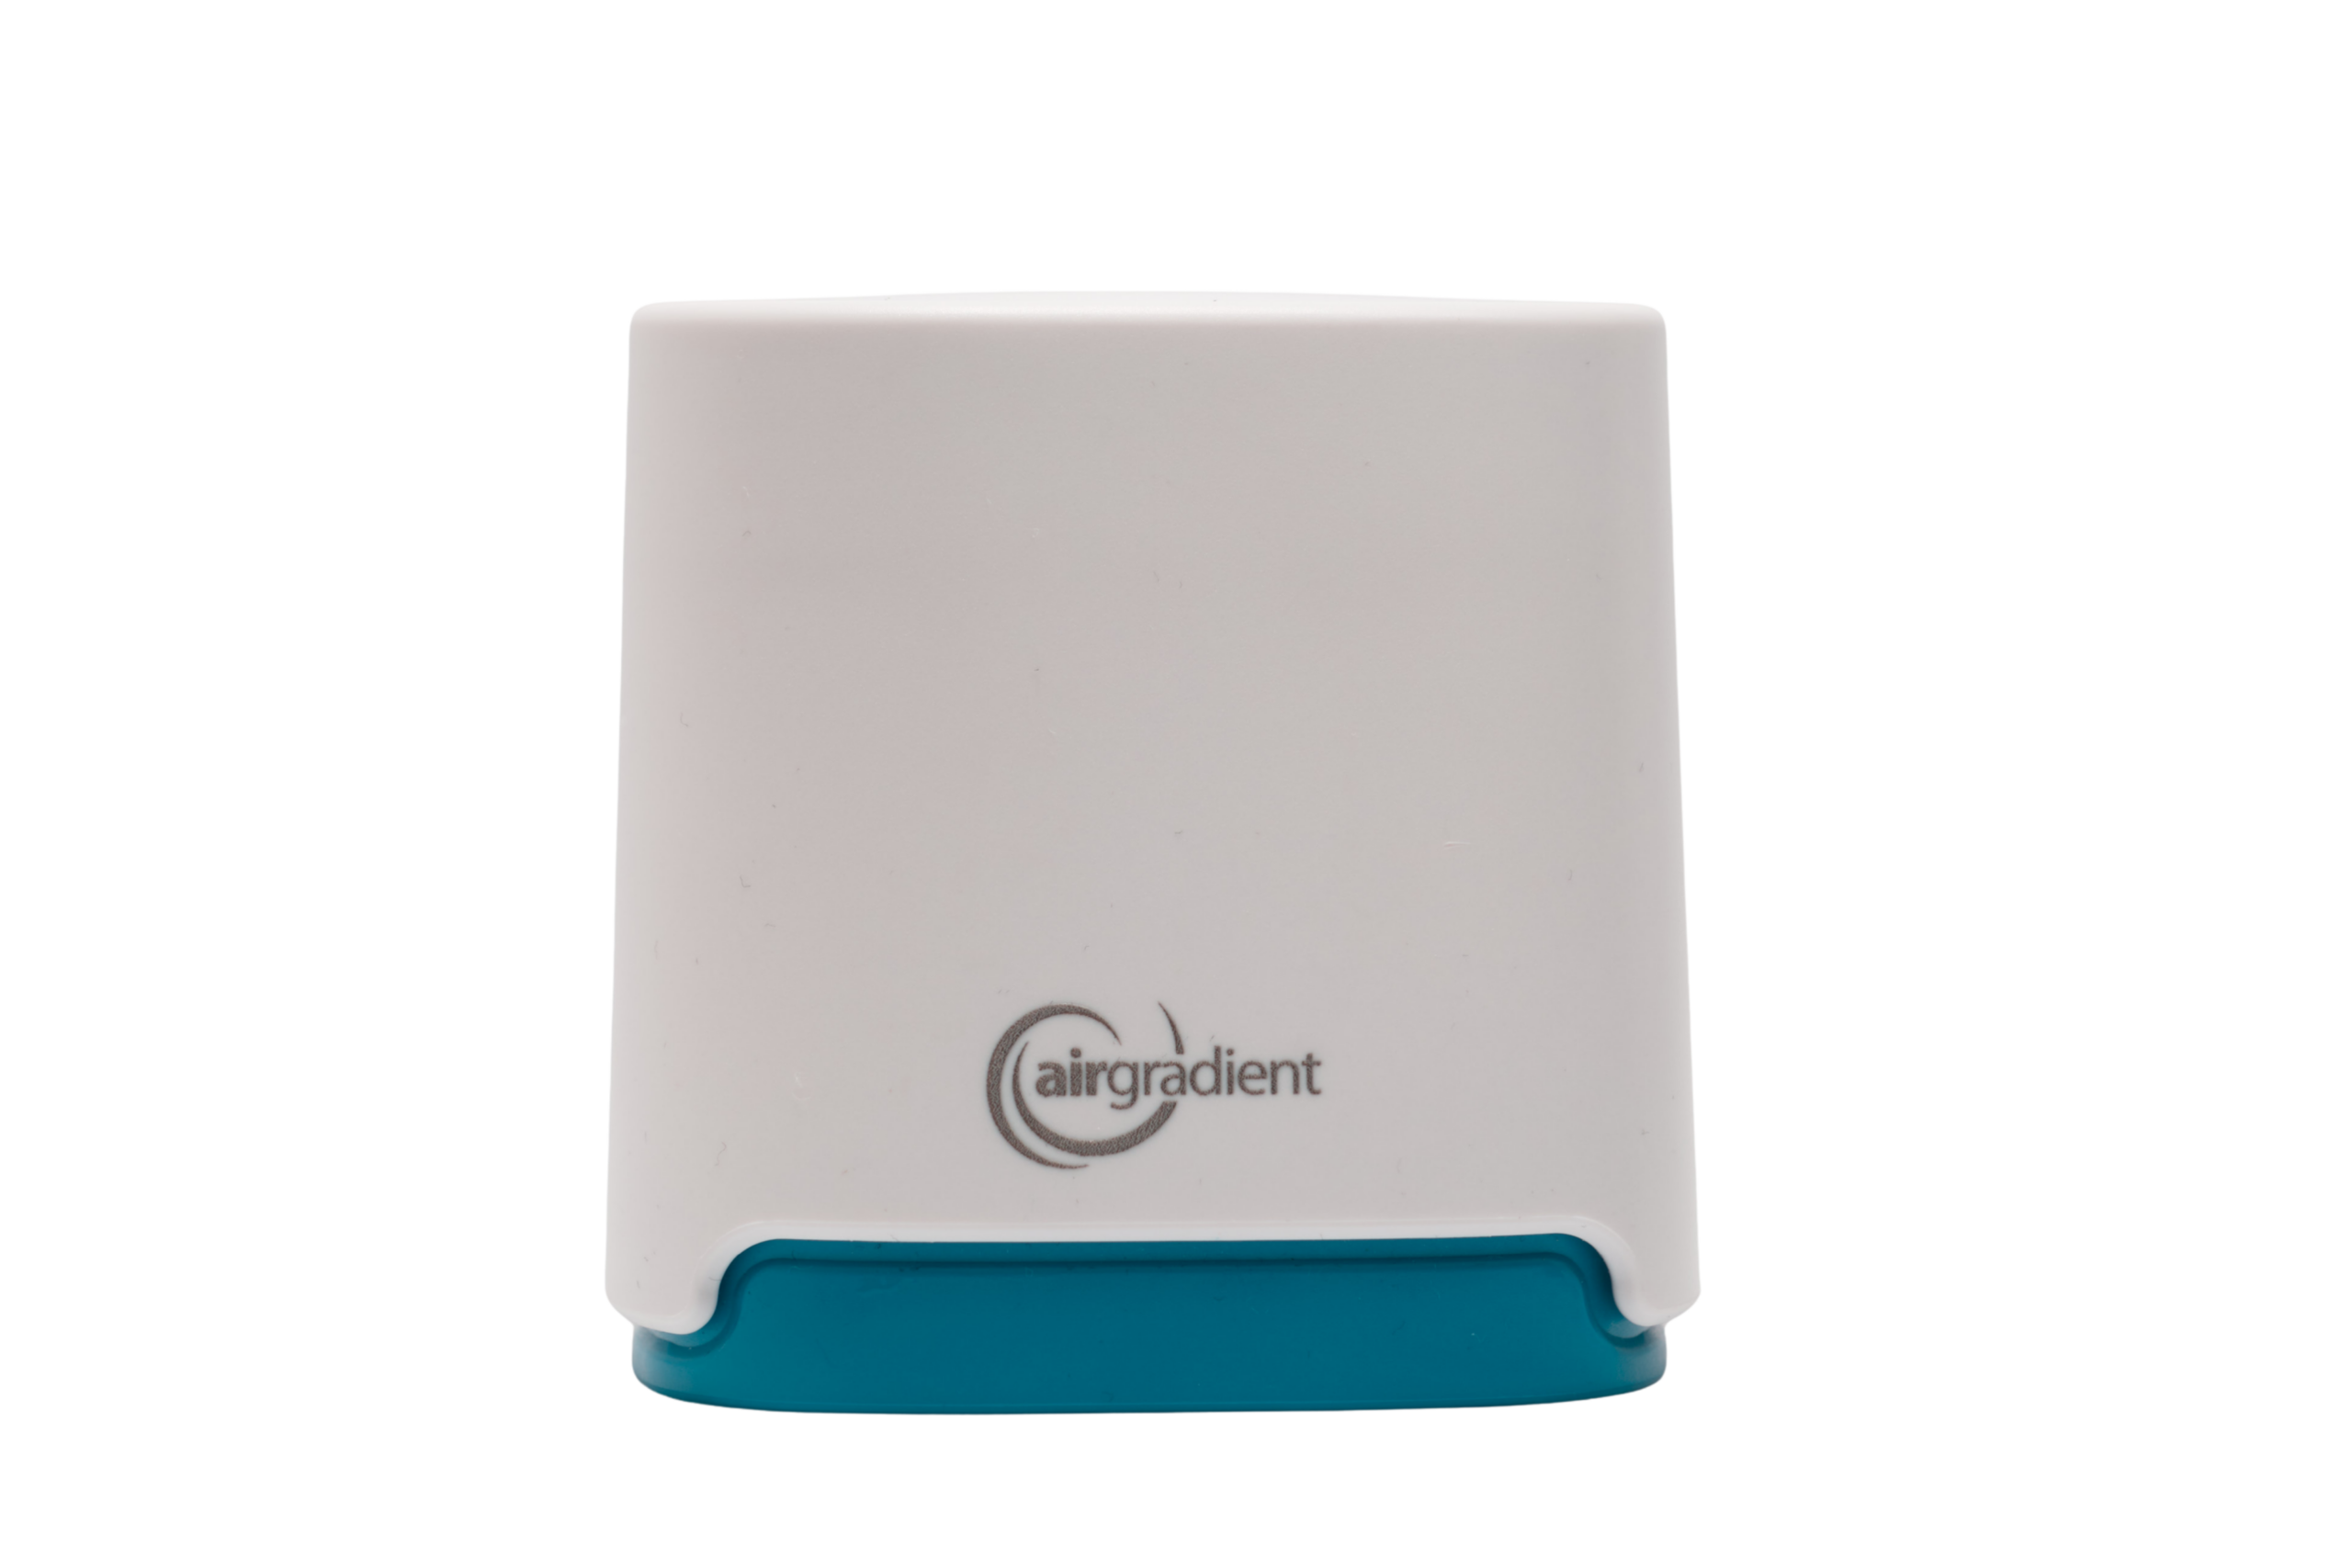
Continuous, localised monitoring of outdoor PM2.5 and conditions.
Learn more →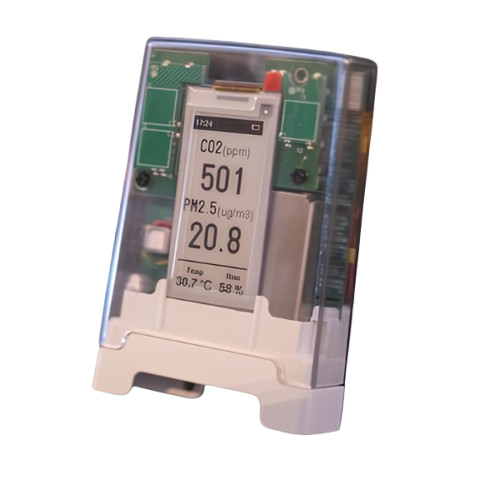
Personal PM2.5, CO₂ and TVOC readings with GPS mapping on the move.
Learn more →Everything in the AirGradient Dashboard for one yearly price, billed as an annual subscription.
Billed annually as a subscription. Renews each year.
Subscribe Now →Works with your connected AirGradient ONE and Open Air monitors (sold separately).
Get the AirGradient Dashboard for $36 per year, or talk to EnviroGuard about the right monitors and setup for your home, school or workplace.
Testimonials
The reporting is clear and easy to share with staff and families. It's reassuring to see room-level data instead of guessing.
Installation was smooth and the system has been low maintenance. The peace of mind is worth it for our classrooms.
We like how it fits into our daily routines — practical recommendations and a clear snapshot we can understand quickly.